
Artificial intelligence is the buzzword everywhere you go: The NASDAQ 100 is up +15% year-to-date, hyperscalers are expected to spend +$750 billion on capex (and that estimate seems to rise each earnings season), and LLM companies, such as Anthropic and OpenAI, have increased revenues at an unbelievable pace (Anthropic’s annualized revenue run rate reportedly rocketed from $9 billion to $47 billion in about six months). All of this is happening after two years of +20% S&P 500 returns, amid geopolitical conflicts, tariffs, the worst energy shock in history1 and consumer confidence near historic lows2—so it’s understandable that many investors feel uneasy.
AI is a broad ecosystem (not a single narrow trade)
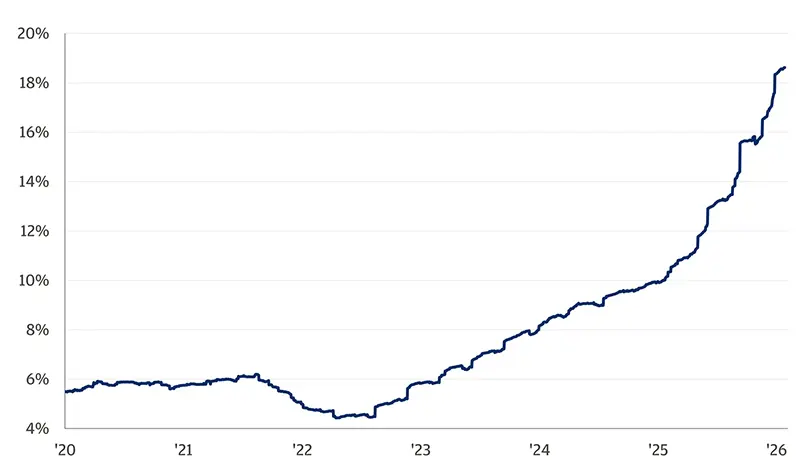
A lot of attention this year has gone to chips and memory. Companies like Sandisk, TSMC and SK Hynix are up sharply, and the semis index is up +39% year-to-date as their net income is becoming a more significant contributor to the S&P 500.
Semi net income has accelerated
Next-twelve-month net income as a % of S&P 500
But performance hasn’t been confined to a small corner of the market. Across the full AI value chain, the theme has been working. An analysis conducted of five different AI baskets containing 148 companies spanning the AI ecosystem (data centers, chips, memory, cooling, hyperscalers, electrification, software, etc.) revealed the following results:
- 70% of names are up year-to-date.
- The median company is up over 20%, outperforming the S&P 500 year-to-date by about 10 ppts.
- Eight of the 11 sectors are represented, and 40% of names are ex-tech.
- Divided by sub-industry, over 2/3 of subgroups are positive.
In other words, AI is showing up as a distributed theme across the value chain.
AI isn’t the only success story
AI and the AI supply chain are an important driver, but they’re not the only thing working.
The most obvious non-AI driver this year has been geopolitics: With the conflict in the Middle East, energy is the top-performing sector in the S&P 500 so far this year, supported by elevated energy prices. That’s an idiosyncratic driver but could reverse.
Beyond that, there are more sustainable themes contributing to performance. Nearshoring remains top of mind, and industrials is a leading sector—driven not only by AI narratives, but also by a broader shift toward domestic and regional investment. Certain sub-sectors within healthcare and financials have performed well, as have certain materials. As Q2 earnings season ramps up, we expect 10 of 11 sectors to post positive earnings growth (six of those in double digits).
Ultimately, AI is likely to be a success story for the entire market. If someone said, “I’m worried the email trade is taking over the market,” it may sound strange—same for “mobile.” Those are technological advancements that became inseparable from corporate productivity and profitability. Over time, AI will become inseparable from the broader market as well. We’re just not there yet.
What does this mean for your portfolio?
The AI story is real and will likely be an integral part of portfolios in the years to come. But diversification, and the inherent importance it has for achieving your long-term goals, is still critical.
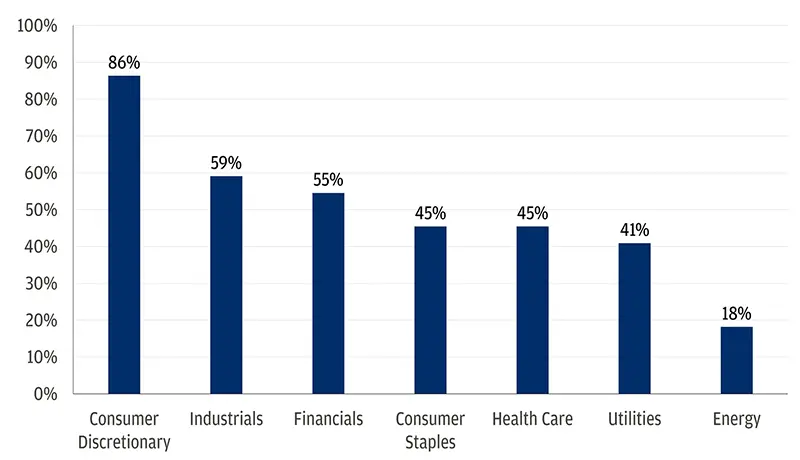
One encouraging development over the past year is that when semiconductors were “risk-off” (defined as one-month rolling compounded daily returns that are less than -5%), other sectors in the S&P 500 weren’t necessarily risk-off too. From a portfolio construction standpoint, this is positive: On days when the semiconductor trade hasn’t worked, other parts of the portfolio have, on average, held up better.
Semis selloff ≠ market selloff
% of days sector is risk-off when Semiconductors are risk off, Year-to-Date
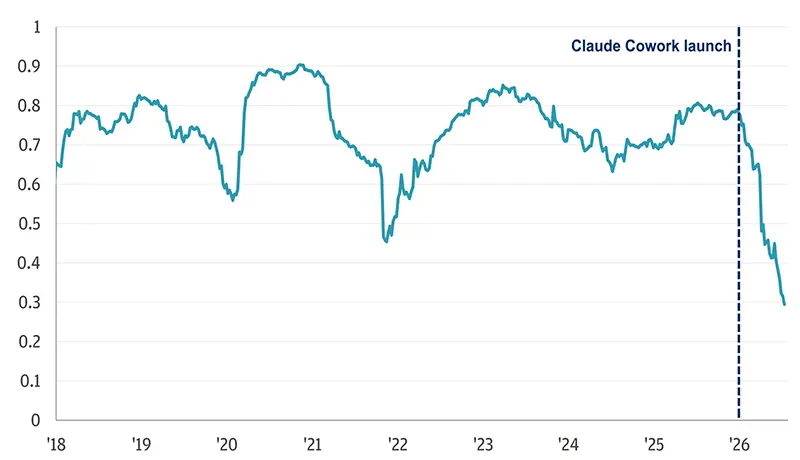
There’s also more breadth: Year-to-date, the average stock is up more than the market-cap weighted index. And importantly, the market is also not tech-blind—i.e., not all tech is being treated equally. After years of nearly perfect correlation between semiconductors and software, the two assets have become much less correlated over the past year as markets reassess who wins in an AI world. Once Claude Cowork came out, it became increasingly clear that parts of traditional software could be challenged as AI capabilities improve.
Post Claude Cowork, Software and Semi correlations have plunged
Software 1-year rolling correlation to Semiconductors
Another divergence emerging more recently is within the hyperscalers. Hyperscaler capex has been the engine of the AI trade for the last few years: Hyperscalers spend, the market rewards them for impressive growth, and the broader AI universe benefits alongside them. But markets are increasingly wary of sustained high spend as these behemoths gradually draw down their cashflows.
Alphabet’s earnings results are a clear example. Despite delivering impressive cloud revenue and a continued ballooning backlog, investors focused on the other side of the equation: Management again guided capex higher and reported its first negative quarter of free cash flow since its initial public offering (IPO). We’re seeing the market become more critical—and more discriminating—across hyperscalers as investors try to separate AI winners from losers. Long-term, the success (or failure) of the hyperscalers to generate an acceptable return on investment on their heavy capex investments, will likely be correlated with the returns of the AI ecosystem.
Ultimately, we think we’re only in the early innings of the AI tech cycle as AI has become much more useful in agentic form. Over time, AI’s reach will continue to grow and extend well beyond technology alone.
Important Information
This material is for information purposes only, and may inform you of certain products and services offered by private banking businesses, part of JPMorgan Chase & Co. (“JPM”). Products and services described, as well as associated fees, charges and interest rates, are subject to change in accordance with the applicable account agreements and may differ among geographic locations. Not all products and services are offered at all locations.
GENERAL RISKS & CONSIDERATIONS
Any views, strategies or products discussed in this material may not be appropriate for all individuals and are subject to risks. Investors may get back less than they invested, and past performance is not a reliable indicator of future results. Asset allocation/diversification does not guarantee a profit or protect against loss. Nothing in this material should be relied upon in isolation for the purpose of making an investment decision. You are urged to consider carefully whether the services, products, asset classes (e.g. equities, fixed income, alternative investments, commodities, etc.) or strategies discussed are suitable to your needs. You must also consider the objectives, risks, charges, and expenses associated with an investment service, product or strategy prior to making an investment decision. For this and more complete information, including discussion of your goals/situation, contact your J.P. Morgan team.
NON-RELIANCE
Certain information contained in this material is believed to be reliable; however, JPM does not represent or warrant its accuracy, reliability or completeness, or accept any liability for any loss or damage (whether direct or indirect) arising out of the use of all or any part of this material. No representation or warranty should be made with regard to any computations, graphs, tables, diagrams or commentary in this material, which are provided for illustration/reference purposes only. The views, opinions, estimates and strategies expressed in this material constitute our judgment based on current market conditions and are subject to change without notice. JPM assumes no duty to update any information in this material in the event that such information changes. Views, opinions, estimates and strategies expressed herein may differ from those expressed by other areas of JPM, views expressed for other purposes or in other contexts, and this material should not be regarded as a research report. Any projected results and risks are based solely on hypothetical examples cited, and actual results and risks will vary depending on specific circumstances. Forward-looking statements should not be considered as guarantees or predictions of future events.
Nothing in this document shall be construed as giving rise to any duty of care owed to, or advisory relationship with, you or any third party. Nothing in this document shall be regarded as an offer, solicitation, recommendation or advice (whether financial, accounting, legal, tax or other) given by J.P. Morgan and/or its officers or employees, irrespective of whether or not such communication was given at your request. J.P. Morgan and its affiliates and employees do not provide tax, legal or accounting advice. You should consult your own tax, legal and accounting advisors before engaging in any financial transactions.